How Do You Stop an Alert Storm When One Table Breaks?
Thirty alerts, one cause. Cooldowns and daily limits do not fix that, because the problem is not volume. It is that nothing knows the alerts are related.
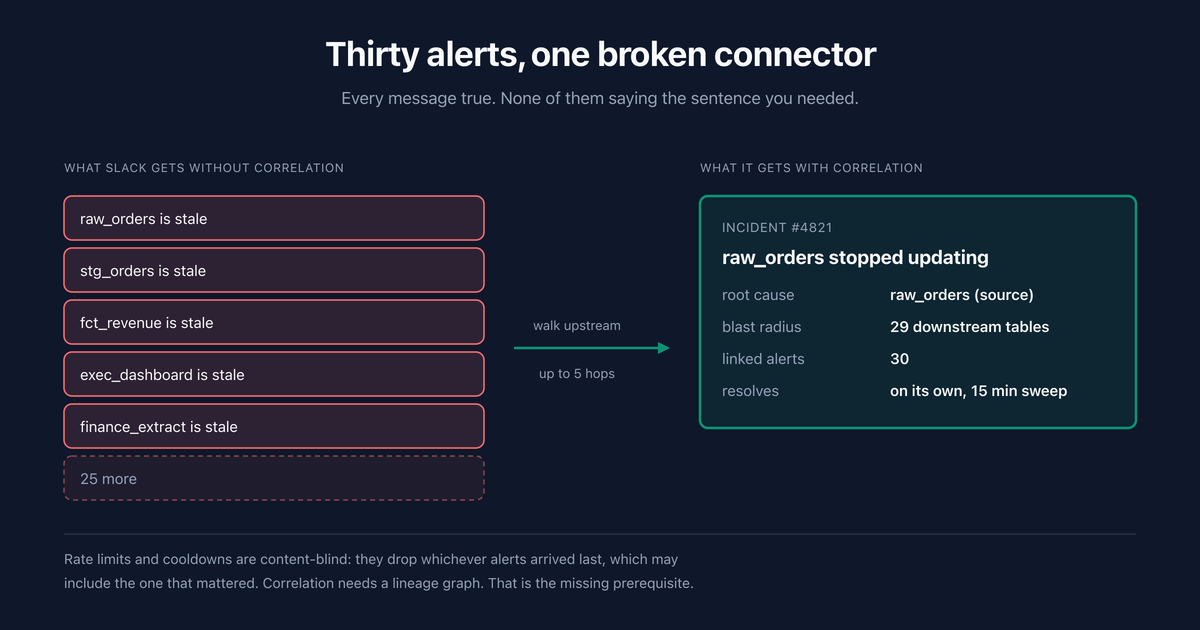
An alert storm is what happens when a single upstream failure produces one alert per affected table, so a broken connector arrives in Slack as thirty separate messages that are all individually true and collectively useless.
The instinct is to turn the volume down. Cooldowns, rate limits, muting the noisy rules. That treats the symptom and makes the underlying problem worse, because the thing you suppress might be the one alert that mattered.
The fix is structural: the alerts need to know they are related, which means something has to know the tables are related.
Why doesn't rate limiting fix this?
Because rate limiting is content-blind. It decides what to drop based on how many alerts fired, not on which ones share a cause.
Look at what suppression actually offers. In our system, an alert can be suppressed for a cooldown being active, a daily limit being reached, the alert already being handled, the time being outside operating hours, or a blackout window. Every one of those is a legitimate control, and not one of them can tell that stg_orders is stale because raw_orders is stale. This is a different problem from tests that fail quietly, where the issue is too little signal rather than too much.
So the daily limit fires after 20 alerts and drops the next 10. Which 10? The ones that happened to arrive last. If the alert that would have told you the finance extract was affected was number 23, you didn't get it, and nothing indicates you didn't.
That is the trade rate limiting always makes: you exchange a storm you can't read for a quiet channel with unknown gaps. Both are failures, and the second is worse because it feels fine.
Cooldowns have a related problem. A cooldown on a single rule stops that rule re-firing, which is genuinely useful for a flapping check. It does nothing about thirty different rules on thirty different tables all firing once, which is exactly the storm shape.
| Control | Stops | Doesn't stop |
|---|---|---|
| Cooldown | One rule re-firing repeatedly | Many rules firing once each |
| Daily limit | Total volume | The wrong alerts being dropped |
| Blackout window | Alerts during a maintenance window | Anything during business hours |
| Operating hours | Out-of-hours noise | The 09:00 storm |
| Correlation | The storm | Genuinely unrelated failures, correctly |
What actually causes a storm?
One failure, N dependent tables, N independent checks that don't know about each other.
The timeline is always roughly the same. A Fivetran sync fails at 19:04. Nothing pages, because a connector failing is not the thing your monitors watch. At 02:00 the transformation job runs against stale source data and succeeds, because stale data is still data. At 06:30 the freshness monitors evaluate, and every table downstream of that connector is now past its threshold.
Thirty alerts. raw_orders is stale. stg_orders is stale. fct_revenue is stale. The executive dashboard's backing table is stale. Three ML feature tables are stale.
Every one of those statements is correct. Not one of them says "a Fivetran connector broke," and that is the only sentence anyone needed.
The missing ingredient is not smarter thresholds. Each individual check did its job perfectly. What is missing is any representation of the fact that these thirty tables sit downstream of one node.
What does a storm cost you?
Worth quantifying, because "too many alerts" reads as an annoyance rather than a cost and it is genuinely both.
The direct cost is triage time. Thirty alerts take roughly 15 minutes to read, correlate by hand, and reduce to a working theory, before any fixing starts. At a loaded engineering cost of $80 to $150 an hour, that is about $29 per incident at the midpoint. Twice a month is under $700 a year, which is a rounding error and not the argument.
The real costs are the two that don't appear on a spreadsheet.
Alert fatigue is cumulative and irreversible. A channel that produces thirty messages for one problem trains people to skim. Once a team has learned to skim, they skim the alert that matters too, and no amount of subsequent tuning retrains them quickly. You are spending credibility, and it does not refill at the rate you spend it.
The muting is permanent. During a storm somebody mutes the noisiest rules to make Slack usable. That is a rational decision under pressure and nobody ever revisits it. Six months later a genuine failure on one of those tables produces nothing at all. I would bet most teams reading this have at least 3 muted rules nobody has looked at since the day they were muted.
The version of this I find most convincing has nothing to do with money. Without correlation you find out how far a problem spread when somebody downstream tells you. With it you tell them first. That difference is the entire reason to care, and it never shows up in a business case.
How does correlation actually work?
It needs a graph. That's the prerequisite and it's why storms persist at teams who have monitoring but never wired up lineage.
The mechanism, concretely. When an alert fires on a table, walk upstream from that table's lineage node, up to 5 hops. Ask which of those upstream assets currently have open incidents. If any do, this alert is a symptom rather than a cause, and it gets attached to the upstream incident instead of creating its own.
If nothing upstream is failing, the table is its own root cause and a new root incident is created for it.
Run that for all thirty alerts and the shape falls out on its own. raw_orders fires first with nothing failing above it, so it becomes a root. Every subsequent alert walks up, finds that open root, and attaches to it. One incident, one Slack message, twenty-nine members.
The difference in what lands in Slack:
# Without correlation
[CRITICAL] raw_orders is stale (11h since last update)
[CRITICAL] stg_orders is stale (9h since last update)
[CRITICAL] fct_revenue is stale (9h since last update)
[WARNING]  dim_customer is stale (9h since last update)
... 26 more

# With correlation
[INCIDENT #4821] raw_orders stopped updating 11h ago
  root cause : raw_orders (source)
  blast radius: 29 downstream tables
  affected    : fct_revenue, exec_dashboard, finance_extract, 3 ML feature tables
  status      : open, 30 linked alerts
Same information, one message, and the second version leads with the sentence you needed.
Two details that matter more than they look.
The root can be promoted after the fact. Alerts don't arrive in dependency order. If fct_revenue alerts before raw_orders does, fct_revenue becomes a root, and when raw_orders alerts a moment later the existing upstream incident gets promoted to root rather than a duplicate being created. Otherwise you'd get two incidents for one cause, which is a smaller storm rather than no storm.
Grouping is keyed on the still-open root, not on a time window. This is the part I'd get wrong if I were designing it from scratch. A time-window approach ("group alerts within 30 minutes") breaks on slow cascades, where a downstream table's check runs hourly and fires ninety minutes after the source. Keying on whether the root is still open means the grouping survives however long the cascade takes.
What does the incident tell you that the alerts didn't?
Three things, and the third is the one that changes your morning.
A named root cause. Not thirty tables that are stale, one table that broke and twenty-nine that are downstream of it.
A blast radius. The incident carries a downstream count and an impact score computed from the graph, so you know how far it spread before you start reading. This is what you paste into the Slack thread when someone asks whether finance is affected.
Who to tell. The list of affected downstream tables is the list of teams to warn. That conversation normally happens after a stakeholder notices; with a blast radius it happens before.
The blast radius post covers the graph side of this in more depth, and it depends on having uploaded lineage, which for dbt users is one command.
Does the incident close itself?
Yes, and the closing logic is worth understanding because it's where this kind of system usually gets annoying.
A sweep runs every 15 minutes over open root incidents. For each one it checks whether every linked alert has cleared. Any still-active alert keeps the root open. When all of them have cleared, the incident auto-resolves with an activity entry recording that the system closed it and how many alerts were linked.
There's a guard worth calling out. A root with no linked alert history is only resolved if it also has no blast-radius members, because members imply an active cascade whose alert history may not be linked yet. Without that check, a fresh incident could close itself in the gap between being created and its alerts being wired up, which is the sort of bug that makes people stop trusting auto-resolution entirely.
The reason this matters: an incident system that requires manual closing accumulates stale incidents until the list is meaningless, and one that closes too eagerly hides live problems. Both failure modes end with people ignoring the incident view.
Where should the incident actually land?
Correlation reduces thirty messages to one. The next question is where that one goes, and routing is where teams undo the benefit they just gained.
The common mistake is routing by rule. Freshness alerts to one channel, schema alerts to another, volume to a third. It feels organized and it splits a single incident across three channels the moment a cascade touches more than one check type, which is most cascades.
Route by ownership instead. The incident belongs to whoever owns the root cause table, because they're the only ones who can fix it. Everyone downstream needs to know, which is a different message with a different urgency, and often a different medium.
That gives you two distinct outputs from one incident:
- To the owner of the root cause: page them. Something they are responsible for is broken and the fix is theirs.
- To the owners of the blast radius: notify them. Their data is suspect and there is nothing for them to do except not trust it and not escalate separately.
Collapsing those two into one broadcast is how you get five people investigating the same incident in parallel, which is its own kind of storm and considerably more expensive than the Slack messages.
A related trap: routing the blast-radius notification to the same channel as the page. The owner then reads their page inside a thread of twenty people saying "is finance affected," and the answer is already in the incident nobody scrolled up to read.
The practical setup is a page to the root owner, a single summary post to a broader channel that names the root cause and the affected set, and no per-table messages anywhere. If a downstream team wants detail, the incident has it.
| Recipient | Medium | Content | Urgency |
|---|---|---|---|
| Root cause owner | Page | What broke, since when, blast radius size | Now |
| Downstream owners | Channel post | Your tables are suspect, root cause named | Awareness |
| Everyone else | Nothing |
The third row is the one worth defending. An incident that notifies people who cannot act on it and are not affected by it is training them to filter you out.
What if the graph is wrong?
Then correlation is wrong, and it will be wrong confidently. Worth knowing the failure modes before you rely on it.
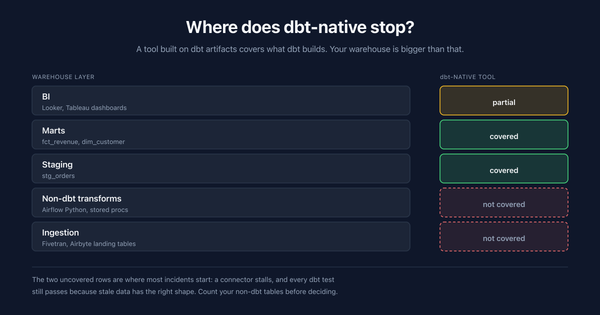
Missing edges cause splitting. If a table's upstream dependency isn't in the graph, the walk finds nothing failing above it and it becomes its own root. You get two incidents for one cause. Annoying, not dangerous, and the usual culprit is a non-dbt pipeline that was never added to the graph.
A stale graph misses recent tables. Models added since your last manifest upload aren't in the graph, so their alerts can't correlate. They arrive as singletons alongside a tidy incident, which reads like they're unrelated when they aren't.
Genuinely simultaneous failures look correlated. If two unrelated things break in the same window and one happens to sit upstream of the other in the graph, they group. The check is to ask whether the affected set actually descends from the named root. Anything outside that node's downstream cone belongs to a different incident.
Depth is bounded at 5 hops. A cascade deeper than that splits into two incidents. On most warehouses that's plenty; on a deeply layered one it's a number worth knowing.
None of these make correlation not worth having. They mean the graph is a dependency of your alerting quality, which is an argument for wiring the manifest upload into CI rather than doing it by hand once.
What should you do this week?
Four steps, roughly an hour.
- Count the alerts in your last multi-table incident. If the answer is more than five, you have a storm problem regardless of what your tooling calls it.
- Check whether you have lineage at all. No graph means no correlation is possible, from any vendor. This is the prerequisite everyone skips.
- Audit what you've muted. Every muted rule is a decision made during a storm that nobody revisited. Some of them are load-bearing.
- Look at whether your suppression is dropping the wrong things. If you have a daily limit, ask which alerts hit it last month. If the answer is unknowable, that is the finding.
A note on step 3, because it is the one people skip. The mute list is the archaeological record of every bad night your team has had. Going through it is uncomfortable and it is also the highest-yield hour in this list, because a muted rule is a monitor you are paying for and not receiving. Unmute them, let one storm happen, and fix it structurally instead.
The general principle: alert volume is a symptom of missing structure, not a problem to be solved with a throttle. Every hour spent tuning thresholds to reduce noise is an hour not spent giving the system the graph that would make the noise collapse on its own.
Frequently asked questions
What is an alert storm?
A burst of alerts from a single underlying failure, where each dependent table triggers its own alert. Thirty messages, one cause, and nothing in any of them indicating the other twenty-nine are symptoms.
Why doesn't rate limiting solve alert storms?
Rate limiting is content-blind. A daily limit that drops alerts after the twentieth drops whichever ones arrived last, which may include the one that mattered. You trade an unreadable storm for a quiet channel with unknown gaps.
What is the difference between a cooldown and correlation?
A cooldown stops one rule re-firing repeatedly, which helps with a flapping check. Correlation groups many different rules that share a root cause, which is the actual shape of a storm.
How does alert correlation work?
When an alert fires, the system walks upstream through the lineage graph looking for assets with open incidents. If it finds one, the alert attaches to that incident as a symptom. If not, the table becomes its own root cause and a new incident opens.
Do I need lineage for alert correlation?
Yes. Correlation is a graph traversal, so with no graph there is nothing to traverse and every alert is its own root. This is the prerequisite most teams are missing when they complain about noise.
What happens if alerts arrive out of dependency order?
The root gets promoted. If a downstream table alerts first it becomes a root, and when the true upstream cause alerts afterwards, the existing incident is promoted rather than a duplicate root being created.
How far upstream does correlation search?
Up to 5 hops. Cascades deeper than that split into separate incidents, which on most warehouses is not a practical limit but is worth knowing if your layering is unusually deep.
Does grouping use a time window?
Not for the primary key. Grouping hangs off whether the root incident is still open, which means slow cascades still group correctly even when a downstream check runs hours after the source failed.
Does the incident resolve automatically?
Yes. A sweep runs every 15 minutes and closes any root whose linked alerts have all cleared, recording an activity entry. A root with members but no linked alert history is deliberately left open, since members imply a cascade whose history may not be wired up yet.
What if two unrelated things break at the same time?
They may group if one happens to sit upstream of the other. Check whether the affected tables actually descend from the named root; anything outside that node's downstream cone belongs to a separate incident.
Why did my alerts not correlate?
Usually a gap in the graph. Either the dependency was never in it, because a non-dbt pipeline produced the table, or the graph is stale and the model was added after the last upload.
Where should a correlated incident be routed?
Page the owner of the root cause table, since they are the only ones who can fix it, and post a single summary to a broader channel so downstream owners know their data is suspect. Skip per-table messages entirely.
Why is routing by alert type a mistake?
Because a single cascade usually trips more than one check type, so freshness-to-one-channel and schema-to-another splits one incident across several places. Route by who owns the root cause instead.
Should I just mute noisy alert rules?
Only as a deliberate, revisited decision. Muting during a storm is how load-bearing alerts get silenced permanently, and nobody audits the mute list afterwards. Fix the structure instead of the volume.