How to Put a Data Quality Agent on Your Snowflake or Databricks Warehouse
Setting up a data quality agent on Snowflake or Databricks takes one connection, not a test-writing project. Connect the warehouse, let the agent profile your tables and build its knowledge base, and it starts monitoring and investigating on its own. Here's the walkthrough.
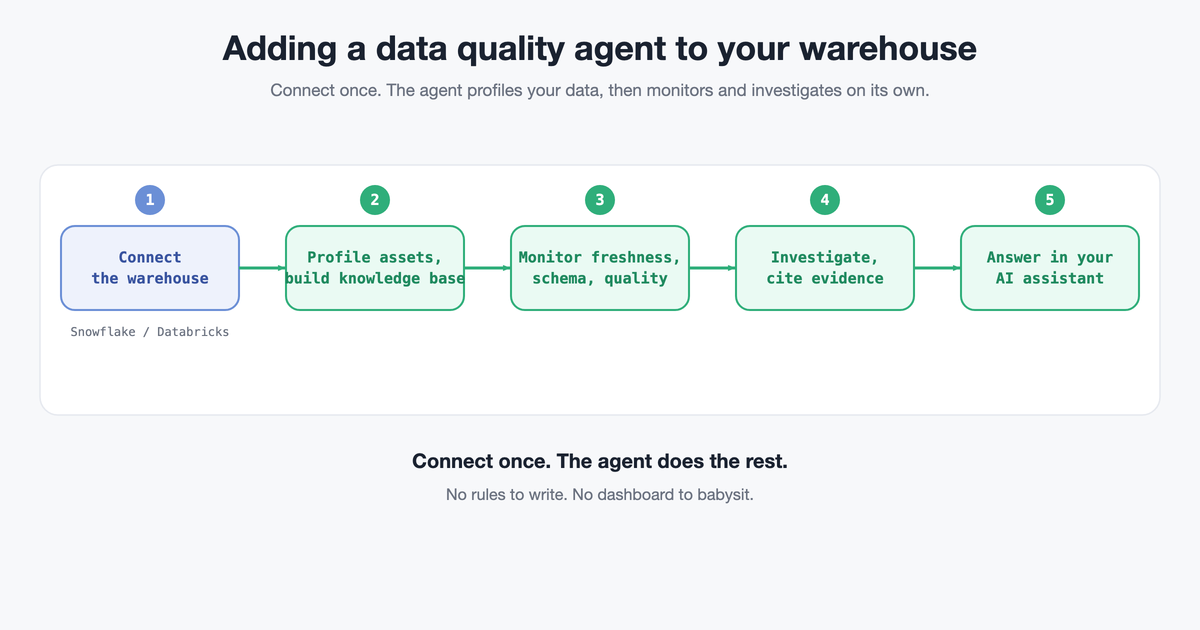
Adding a data quality agent to Snowflake or Databricks is one connection, not a project. You grant read access to your metadata, the agent profiles your tables and builds a knowledge base of what normal looks like, and then it monitors freshness, schema, and quality and investigates issues on its own. There's no test suite to author first and no dashboard to configure. If you've set up a traditional monitoring tool before and remember the weeks of writing rules, this is deliberately not that.
Here's what the setup actually looks like, what happens after you connect, and the handful of things worth getting right on each warehouse.
The five steps
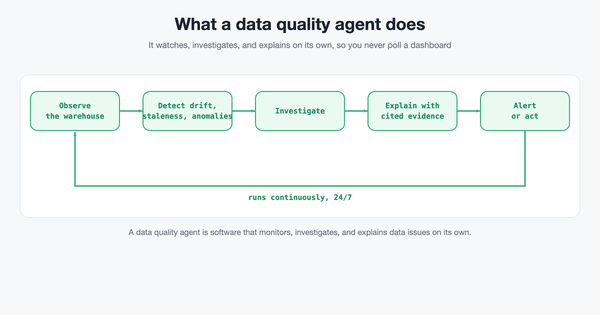
The whole flow is short enough to describe in one breath: connect, profile, monitor, investigate, answer.
1. Connect the warehouse. You create a read-only role for the agent and give it access to the schemas you want watched. On Snowflake that's a role with USAGE and SELECT plus access to INFORMATION_SCHEMA and ACCOUNT_USAGE. On Databricks it's a service principal with SELECT on the catalogs and schemas, reading from Unity Catalog. Either way, read-only. The agent never needs write access to your data to do its job.
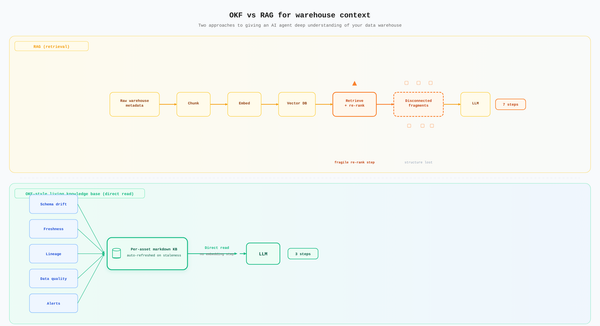
2. The agent profiles your assets and builds its knowledge base. This is the step that replaces the weeks of manual rule-writing. Once connected, the agent walks your tables and learns each one: its schema, how often it loads, its typical row counts and distributions, and how it connects to everything upstream and downstream. It writes that into a knowledge base it keeps current, so it isn't relearning your warehouse on every question. We built that knowledge layer as a living document the agent maintains rather than a one-time scan.
3. It monitors freshness, schema, and quality. With the baseline learned, the agent watches for deviations: a table that's late against its usual load pattern, a column that changed type or disappeared, a null rate or row count that jumped. You didn't write a rule for any of these. It inferred what to watch from the profiling step.
4. It investigates. When something trips, the agent doesn't just fire an alert. It correlates across sources to find the likely cause: the upstream schema change from last night, the failed sync, the lineage path to the dashboards that depend on the broken table. This is the work that normally eats your morning, done as a first pass before you see it.
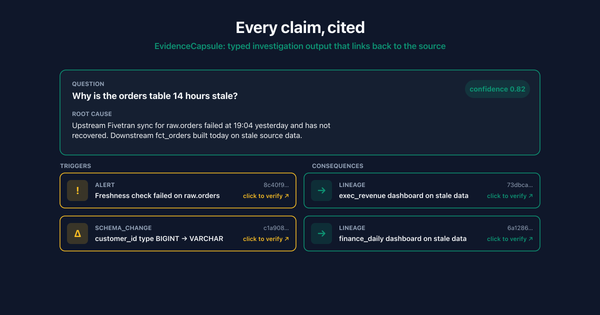
5. It answers where you work. The findings come to you in plain language, with the evidence attached, through your AI assistant or a chat surface instead of one more console to check. Every claim links back to the record it came from, so you can verify it in a couple of clicks rather than taking the agent's word.
Snowflake specifics
On Snowflake, the agent leans on two things you already have. INFORMATION_SCHEMA gives it live schema and table structure. ACCOUNT_USAGE gives it load history and query patterns, which is how it learns freshness baselines without you defining SLAs by hand. Grant a dedicated monitoring role rather than reusing an existing one, so the access is easy to audit and revoke. Point it at your production and mart schemas first; those are where a stale table or a dropped column actually hurts a dashboard.
If you run dbt on Snowflake, keep your existing tests. The agent covers the tables and columns you never wrote tests for and does the investigation when a test does fail. The two are complementary, and we've argued before that you shouldn't rely on dbt tests alone to catch silent failures.
Databricks specifics
On Databricks the mechanics are the same idea through Unity Catalog. You create a service principal, grant it SELECT and the catalog and schema USE privileges, and the agent reads lineage and table metadata from Unity Catalog directly. Because Unity Catalog already tracks column-level lineage, the agent gets a strong head start on the "what depends on this table" question, which makes its investigations sharper on the downstream-impact side.
Whether you're on Snowflake or Databricks, the setup effort is the same and the agent behaves the same. We don't treat one as a first-class warehouse and the other as an afterthought, because most real data teams run some of both and the monitoring shouldn't care which table lives where.
What you get once it's running
- Coverage of tables you'd never have written tests for. The long tail is where silent failures hide, and the agent watches it by default.
- Freshness and schema monitoring without defining SLAs by hand. It learns the load pattern and flags deviations from it.
- A first-pass investigation on every incident. You wake up to a likely cause and the evidence sitting next to the red alert, instead of the alert alone.
- Findings you can verify. Because every claim cites a record, you develop calibrated trust instead of blindly following the agent.
FAQ
How long does setup take?
The connection itself is minutes. The profiling pass runs after that and depends on how many tables you point it at, but you're not doing anything during it. Compare that to the multi-week effort of authoring a rule set on a traditional tool.
Does it need write access to my warehouse?
No. Read-only on metadata and the schemas you want monitored is enough. The agent works off structure, load history, and lineage, not by copying your rows.
Will it touch my data or move it out of the warehouse?
It operates on metadata: schema, load times, row counts, distributions, and lineage. It doesn't need to extract your actual records to monitor them, which keeps the security review short.
Can I limit it to specific schemas?
Yes, and you should start narrow. Point it at your production marts and the tables feeding real dashboards first, confirm the signal is good, then widen access from there.
Does it work alongside dbt and my existing pipeline?
Yes. It sits beside your dbt tests and orchestration, covering the gaps they don't and investigating failures when they happen. You don't replace anything to add it.
AnomalyArmor is a data quality agent for Snowflake and Databricks, priced at $5 per table and currently in private beta. If you want it profiling your warehouse this week instead of a rule-writing project next quarter, reach out and we'll get you access.