What Is Data Downtime and How Do You Measure It?
Data downtime is the total time your data is missing, inaccurate, or otherwise unusable. This guide explains how to calculate it using TTD and TTR, estimate the dollar cost per hour, reduce it with automated monitoring, and benchmark your team against industry norms.

Data downtime is the total period during which data is missing, erroneous, or otherwise unfit for use. It is the data equivalent of application downtime: the window between when something breaks and when it is fully resolved. During data downtime, dashboards show wrong numbers, ML models ingest bad features, and business users make decisions based on information they cannot trust.
The standard formula is:
Data Downtime = (Time to Detection + Time to Resolution) x Number of Incidents
A team that takes 8 hours to notice a broken pipeline (TTD) and 4 hours to fix it (TTR) accumulates 12 hours of downtime per incident. If that happens 10 times a month, the team has 120 hours of data downtime per month, roughly 16% of total available hours.
This guide breaks down how to measure TTD and TTR, how to estimate the dollar cost of downtime, how to reduce both metrics, and how data downtime relates to broader data observability practices.
Why does data downtime matter?
Data downtime is expensive in ways that don't show up on infrastructure bills. The costs are indirect but real:
- Bad business decisions: A marketing team running a campaign based on stale conversion data will misallocate spend. A finance team reporting revenue from a pipeline that silently dropped 20% of transactions will publish incorrect numbers.
- Lost engineering time: Data engineers spend 30-40% of their time firefighting data quality issues according to multiple industry surveys, including reports from Monte Carlo and Wakefield Research. Every hour of downtime generates follow-up work: root cause analysis, stakeholder communication, manual data patches.
- Eroded trust: When dashboards are wrong often enough, business users stop trusting the data platform entirely. They build shadow spreadsheets, export CSVs, and do manual reconciliation. Once trust is gone, it takes months to rebuild even after the technical problems are fixed.
- Compliance risk: For regulated industries, data downtime in reporting pipelines can mean missed filing deadlines, incorrect disclosures, or audit findings.
The DAMA International Data Management Body of Knowledge (DMBOK) frames data quality as a continuous process, not a one-time check. Data downtime is the metric that quantifies how well that continuous process is working.
How much does data downtime cost?
Estimating the dollar cost of data downtime helps justify investment in monitoring. The calculation depends on two factors: engineering time spent on incidents and the business impact of decisions made on bad data.
Engineering cost per incident
Engineering cost = (TTD + TTR) x Number of engineers involved x Hourly loaded cost
A fully loaded data engineer in the US costs $80-150/hour (salary + benefits + overhead). If a typical incident involves 2 engineers spending a combined 6 hours (2 hours detecting, 4 hours fixing), each incident costs $480-900 in engineering time alone.
Business impact cost
Business impact is harder to quantify but often dwarfs engineering cost. Examples:
| Scenario | Estimated cost per hour of bad data |
|---|---|
| Marketing campaign running on stale conversion data | $500-5,000 in misallocated ad spend |
| Revenue dashboard showing incorrect totals during board prep | 10-40 hours of manual reconciliation by finance |
| ML recommendation model trained on corrupted features | Degraded conversion rate until retraining completes |
| Compliance report filed with missing transactions | Potential regulatory penalty + audit remediation |
Total cost formula
Monthly cost of data downtime =
  (Avg incidents/month x Avg engineers/incident x Avg hours/incident x Hourly rate)
  + Estimated business impact per incident x Avg incidents/month
For a mid-size data team with 10 incidents per month, 2 engineers per incident at $100/hour, and 6 hours per incident:
- Engineering cost: 10 x 2 x 6 x $100 = $12,000/month
- Business impact: varies, but even a conservative $1,000/incident adds $10,000/month
A team spending $22,000/month on data downtime can justify significant investment in monitoring tooling. For context, AnomalyArmor prices at $5/table/month for automated monitoring across schema drift, freshness, and anomaly detection.
How do you calculate data downtime?
Data downtime has two components that you measure separately and then combine:
Time to Detection (TTD)
TTD is the elapsed time between when a data issue occurs and when someone (or something) detects it. If a pipeline breaks at 2:00 AM and a data engineer notices at 10:00 AM, TTD is 8 hours.
Most teams discover their TTD is shockingly high. Without automated monitoring, the typical detection method is a Slack message from a business user: "Hey, the dashboard looks wrong." By that point, the issue has often been present for hours or days.
-- Measure TTD: compare when the issue started vs. when it was detected
-- Requires an incident log table with timestamps
SELECT
  incident_id,
  issue_started_at,
  issue_detected_at,
  TIMESTAMP_DIFF(issue_detected_at, issue_started_at, MINUTE) AS ttd_minutes
FROM data_incidents
WHERE resolved_at IS NOT NULL
ORDER BY ttd_minutes DESC;

-- Average TTD over the last 30 days
SELECT
  ROUND(AVG(TIMESTAMP_DIFF(issue_detected_at, issue_started_at, MINUTE)), 1) AS avg_ttd_minutes,
  MAX(TIMESTAMP_DIFF(issue_detected_at, issue_started_at, MINUTE)) AS max_ttd_minutes,
  COUNT(*) AS total_incidents
FROM data_incidents
WHERE issue_started_at >= DATE_SUB(CURRENT_DATE(), INTERVAL 30 DAY);
Time to Resolution (TTR)
TTR is the elapsed time between detection and full resolution. "Full resolution" means the data is correct and downstream consumers have been updated, not just that the pipeline is running again. A pipeline restart that reprocesses data but leaves a 3-hour gap in the destination table is not a full resolution.
-- Measure TTR per incident
SELECT
  incident_id,
  issue_detected_at,
  resolved_at,
  TIMESTAMP_DIFF(resolved_at, issue_detected_at, MINUTE) AS ttr_minutes,
  root_cause_category
FROM data_incidents
WHERE resolved_at IS NOT NULL
ORDER BY ttr_minutes DESC;

-- TTR breakdown by root cause
SELECT
  root_cause_category,
  COUNT(*) AS incidents,
  ROUND(AVG(TIMESTAMP_DIFF(resolved_at, issue_detected_at, MINUTE)), 1) AS avg_ttr_minutes,
  ROUND(AVG(TIMESTAMP_DIFF(issue_detected_at, issue_started_at, MINUTE)), 1) AS avg_ttd_minutes
FROM data_incidents
WHERE resolved_at IS NOT NULL
  AND issue_started_at >= DATE_SUB(CURRENT_DATE(), INTERVAL 90 DAY)
GROUP BY root_cause_category
ORDER BY incidents DESC;
Combining TTD and TTR
Total downtime per incident is simply TTD + TTR. To get your monthly data downtime:
-- Monthly data downtime in hours
SELECT
  DATE_TRUNC(issue_started_at, MONTH) AS month,
  COUNT(*) AS incidents,
  ROUND(SUM(
    TIMESTAMP_DIFF(resolved_at, issue_started_at, MINUTE)
  ) / 60.0, 1) AS total_downtime_hours,
  ROUND(AVG(
    TIMESTAMP_DIFF(issue_detected_at, issue_started_at, MINUTE)
  ), 1) AS avg_ttd_minutes,
  ROUND(AVG(
    TIMESTAMP_DIFF(resolved_at, issue_detected_at, MINUTE)
  ), 1) AS avg_ttr_minutes
FROM data_incidents
WHERE resolved_at IS NOT NULL
GROUP BY DATE_TRUNC(issue_started_at, MONTH)
ORDER BY month DESC;
A healthy target for mature data teams is less than 4 hours of total downtime per month across all pipelines. Most teams starting out measure in the range of 40-100+ hours per month.
Anatomy of a data downtime incident
To make data downtime concrete, here is a realistic example of how a single schema change cascades into 14 hours of downtime.
Timeline:
| Time | Event |
|---|---|
| 11:00 PM (Tue) | Partner API deploys v3, adding a required currency_code field to the payments endpoint and changing amount from integer cents to decimal dollars. No changelog published. |
| 11:15 PM | Airflow ingestion DAG runs on schedule, pulls the new payload, and loads it into the raw_payments staging table. The DAG succeeds with no errors because the new field is simply an extra column. |
| 11:30 PM | dbt runs the nightly transform. The stg_payments model casts amount as INTEGER, silently truncating 49.99 to 49. Downstream fct_revenue now understates revenue by ~49%. The dbt run completes successfully. |
| 6:00 AM (Wed) | The finance team opens the daily revenue dashboard for the morning standup. Numbers look "a little off" but within the range of normal daily fluctuation. No one raises a flag. |
| 1:00 PM | A product manager notices that yesterday's conversion value in the marketing attribution report is half of what the ad platform shows. She Slack-messages the data team: "Is the revenue number right?" |
| 1:15 PM | On-call data engineer begins investigating. Checks the Airflow logs (no errors). Checks dbt logs (no errors). Manually queries raw_payments and notices the amount field now has decimal values. Finds the new currency_code column. |
| 2:00 PM | Engineer identifies the root cause: upstream schema change. Writes a fix for the stg_payments model to handle the new decimal format and adds the currency_code field. |
| 3:00 PM | Fix is deployed, dbt full-refresh runs, downstream tables rebuilt. Finance confirms the numbers are correct. Incident closed. |
Downtime calculation:
- TTD: 11:00 PM to 1:00 PM next day = 14 hours
- TTR: 1:00 PM to 3:00 PM = 2 hours
- Total downtime: 16 hours
- Revenue dashboard was wrong for 14 hours before anyone noticed
With automated schema change monitoring, the new currency_code column and the type change on amount would have triggered an alert at 11:15 PM, cutting TTD from 14 hours to 15 minutes.
What causes data downtime?
Data downtime has five primary root causes. Understanding the distribution helps you prioritize where to invest in prevention.
| Root cause | Typical % of incidents | Example |
|---|---|---|
| Schema changes | 25-35% | An upstream API adds a new required field, breaking the ingestion job |
| Data freshness failures | 20-30% | A scheduled pipeline silently fails and no new data arrives |
| Data volume anomalies | 15-20% | A source table that normally has 1M rows/day suddenly has 100 rows |
| Data distribution anomalies | 10-15% | A column that's normally 2% null jumps to 40% null |
| Code/logic changes | 10-15% | A dbt model refactor introduces a join that drops 30% of rows |
Schema changes and freshness failures together account for roughly half of all data downtime. This is why most data observability tools prioritize automated schema change detection and freshness monitoring as their first capabilities.
How do you reduce TTD?
Reducing TTD is the highest-leverage improvement most data teams can make. Moving from "business user reports a problem" to "automated alert fires within minutes" typically cuts TTD from hours or days down to single-digit minutes.
1. Automated freshness monitoring
Check every table's last-updated timestamp against its expected schedule. If orders is normally updated by 6:00 AM and it's 6:30 AM with no new rows, fire an alert immediately.
-- Freshness check: flag tables that haven't been updated on schedule
SELECT
  table_name,
  expected_update_interval_hours,
  TIMESTAMP_DIFF(CURRENT_TIMESTAMP(), last_updated_at, HOUR) AS hours_since_update
FROM table_metadata
WHERE TIMESTAMP_DIFF(CURRENT_TIMESTAMP(), last_updated_at, HOUR) > expected_update_interval_hours;
2. Schema change detection
Compare the current schema of every table against its last known schema. Any added, removed, or type-changed column triggers an alert before downstream models run.
3. Volume anomaly detection
Track row counts over time and flag statistically significant deviations. A table that normally receives 500K-600K rows per day but suddenly receives 50K is almost always broken.
4. Distribution monitoring
Track key column statistics (null rate, distinct count, min/max, mean) and flag when they drift outside historical norms. This catches subtle data quality issues that volume checks miss.
5. Circuit breakers in pipelines
Add pre-load validation steps that halt a pipeline if the source data fails basic sanity checks. This prevents bad data from propagating downstream and turns a multi-table incident into a single-table incident.
How do you reduce TTR?
TTR reduction requires operational investment in tooling, documentation, and incident response processes.
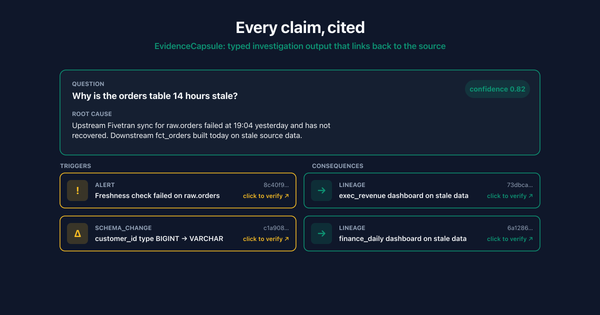
1. Automated root cause analysis
When an alert fires, the monitoring system should immediately surface: which table is affected, what changed, when it changed, and which upstream source is responsible. Without this context, engineers waste 30-60 minutes just figuring out where to look.
2. Lineage-aware alerting
If a source table breaks, don't fire separate alerts for every downstream table that inherits the problem. Use data lineage to identify the root table and alert on that, with a note about the blast radius of affected downstream assets.
3. Runbooks per failure type
Document the fix for each common failure mode. Schema change on the payments API? Here's the runbook. Freshness failure on the Snowflake warehouse? Here's the runbook. When an incident fires at 3:00 AM, the on-call engineer should not be debugging from scratch.
4. Automated remediation
For known failure patterns, automate the fix entirely. If a pipeline fails because of a transient API timeout, retry automatically. If a source table arrives late but eventually shows up, backfill automatically once the data lands. Reserve human intervention for novel failures.
5. Data SLAs with upstream teams
Formalize agreements with upstream data producers about schema change notification windows, expected freshness, and volume ranges. When upstream teams know that unannounced schema changes cause downstream incidents, they're more likely to communicate proactively.
Data downtime vs application downtime
Data downtime and application downtime are related concepts that require different detection strategies. Application monitoring tools (Datadog, PagerDuty, New Relic) do not catch data downtime because data issues are often invisible at the infrastructure layer.
| Dimension | Application downtime | Data downtime |
|---|---|---|
| Definition | Service is unavailable or unresponsive | Data is missing, stale, or incorrect |
| Detection | Health checks, HTTP status codes, latency metrics | Schema checks, freshness SLAs, volume/distribution anomalies |
| Visibility | Obvious (users see errors, pages don't load) | Silent (dashboards render but show wrong numbers) |
| Typical TTD | Seconds to minutes (automated monitoring is standard) | Hours to days (many teams still rely on manual detection) |
| Blast radius | Users of the affected service | Every downstream consumer of the affected data |
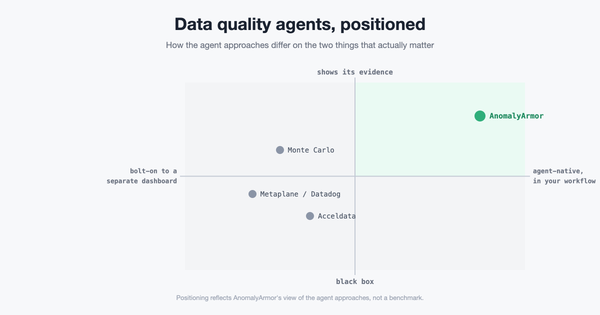
| Tooling | Datadog, PagerDuty, New Relic, Prometheus | AnomalyArmor, Monte Carlo, Metaplane, Great Expectations |
| Cultural maturity | Well-established SRE practices | Emerging "data SRE" or "data reliability engineering" |
The key difference is visibility. When an application goes down, users immediately see error pages and the team gets paged. When data goes bad, the pipeline still runs, the dashboard still renders, and nobody knows the numbers are wrong until a human spots the discrepancy. This is why automated data anomaly detection is critical.
How is data downtime different from data observability?
Data downtime is a metric. Data observability is a practice.
Data downtime measures the outcome: how much time your data spent in an unusable state. Data observability is the set of tools, processes, and practices that let you detect, diagnose, and resolve data issues, thereby reducing downtime.
The relationship is similar to application reliability engineering. Application uptime is the metric. Site reliability engineering (SRE) is the practice. You measure uptime to evaluate how well your SRE practices are working, and you invest in SRE to improve uptime.
A data team with good observability will have low downtime. But observability alone is not enough. You also need incident response processes, data SLAs, and a culture of treating data issues with the same urgency as application outages.
The DAMA DMBOK describes this as "data quality management," which includes establishing quality standards, measuring against them, and continuously improving. Data observability is the modern, tooling-driven implementation of that principle applied to production data pipelines.
What is a good data downtime benchmark?
Benchmarks vary by industry and data maturity, but general guidelines based on industry reports and practitioner surveys:
| Maturity level | Monthly downtime | TTD | TTR |
|---|---|---|---|
| No monitoring | 100+ hours | Days | Hours to days |
| Basic (manual checks, dbt tests) | 40-80 hours | Hours | Hours |
| Intermediate (automated alerts) | 10-30 hours | Minutes to 1 hour | 1-4 hours |
| Advanced (full observability) | < 4 hours | < 5 minutes | < 1 hour |
The biggest jump happens between "no monitoring" and "intermediate." Adding automated freshness and schema monitoring alone can cut TTD by 90% or more. The jump from intermediate to advanced requires investment in lineage, automated root cause analysis, and incident response processes.
Data uptime SLA targets
Teams that formalize data reliability use SLA-style targets, similar to how application teams use "nines" of uptime:
| Data uptime target | Allowed downtime per month | Typical team profile |
|---|---|---|
| 99.9% (three nines) | ~43 minutes | Tier-1 financial/compliance pipelines |
| 99.5% | ~3.6 hours | Mature data teams with full observability |
| 99% | ~7.3 hours | Teams with automated monitoring, some manual steps |
| 95% | ~36 hours | Teams with basic monitoring and ad-hoc incident response |
| < 90% | 73+ hours | No systematic monitoring |
For most teams, 99.5% data uptime (under 4 hours/month) is a reasonable first target. Achieving it requires automated TTD (monitoring catches issues in minutes, not hours) and documented TTR processes (runbooks, automated remediation for common failures).
How do you track data downtime over time?
Tracking downtime requires an incident log. Every detected data issue should be recorded with timestamps for when it started, when it was detected, and when it was resolved.
Most teams track this in one of three ways:
- Dedicated incident table: A table in your warehouse with one row per incident, populated automatically by your monitoring tool or manually during incident response.
- Incident management tool: PagerDuty, Opsgenie, or a similar tool that already tracks TTD and TTR for application incidents. Add data incidents to the same workflow.
- Observability platform metrics: Tools like AnomalyArmor, Monte Carlo, and Metaplane track incidents and resolution times natively, providing dashboards for downtime trends without manual logging.
The key is consistency. If you only log some incidents, your downtime metric will be artificially low and you will not see the improvement trend when you invest in better monitoring.
Data downtime incident response plan
Teams that resolve data incidents quickly share a common trait: a documented response plan that engineers follow before they start debugging. Here is a minimal template:
Step 1: Assess blast radius. Which tables, dashboards, and teams are affected? Use data lineage if available. Notify impacted stakeholders immediately, even before the root cause is known.
Step 2: Stop the bleeding. If bad data is actively flowing downstream, pause the pipeline or add a circuit breaker. It is better to have stale data than actively wrong data.
Step 3: Identify root cause. Check: Did the schema change? Is the source table fresh? Is the row count normal? Are column distributions within range? Start with the most common causes (schema, freshness) before investigating rare ones.
Step 4: Fix and validate. Apply the fix, backfill affected data, and verify correctness with stakeholders. A pipeline that runs green is not enough. Confirm that the output numbers match expectations.
Step 5: Update the incident log. Record TTD, TTR, root cause, and the fix applied. This data feeds your downtime tracking and helps identify recurring patterns.
Step 6: Prevent recurrence. Add monitoring that would have caught this issue earlier. Update runbooks. If the root cause was an unannounced upstream change, follow up with the upstream team about notification SLAs.
Data Downtime FAQ
What is data downtime?
Data downtime is the total period during which data is missing, erroneous, or otherwise unfit for use by downstream consumers. It is measured as the sum of Time to Detection (TTD) and Time to Resolution (TTR) across all incidents in a given period. The formula is: Data Downtime = (TTD + TTR) x Number of Incidents.
What is the difference between TTD and TTR?
Time to Detection (TTD) is the elapsed time between when a data issue occurs and when it is noticed. Time to Resolution (TTR) is the elapsed time between detection and full resolution, meaning the data is correct and downstream systems have been updated. TTD measures how fast you find problems. TTR measures how fast you fix them.
How much does data downtime cost?
The cost depends on engineering time and business impact. A typical incident involving 2 engineers for 6 hours at $100/hour loaded cost is $1,200 in engineering time alone. Business impact (bad decisions, manual reconciliation, compliance risk) often adds $1,000-5,000 per incident. A team with 10 incidents per month can easily spend $20,000+/month on data downtime.
How much data downtime is normal?
Teams without automated monitoring typically experience 100+ hours of data downtime per month. Teams with basic monitoring (freshness checks, dbt tests) average 40-80 hours. Teams with full data observability platforms target less than 4 hours per month. Your starting point depends on the number of pipelines, upstream sources, and the rate of change in your data environment.
What is the biggest cause of data downtime?
Schema changes and freshness failures together account for roughly 50-60% of data downtime incidents. Schema changes are particularly damaging because they often cascade through multiple downstream models before detection. Freshness failures are common because scheduled pipelines fail silently unless explicitly monitored.
How do you reduce data downtime without buying a tool?
Start with three free practices. First, add freshness checks to your orchestrator (Airflow, dbt, Dagster) that verify table update timestamps after each run. Second, add row count assertions that compare today's load volume against a trailing average. Third, create a shared incident log (even a spreadsheet) to track TTD and TTR so you have a baseline to measure improvement against.
What tools help reduce data downtime?
Data observability platforms including AnomalyArmor, Monte Carlo, Metaplane, and Bigeye provide automated monitoring for freshness, schema changes, volume anomalies, and distribution drift. Open-source tools like Great Expectations and Soda Core handle rule-based validation checks. AnomalyArmor offers automated anomaly detection at $5/table, roughly half the cost of comparable commercial tools.
Is data downtime the same as pipeline failure?
No. Pipeline failure is one cause of data downtime, but not the only one. A pipeline can succeed (run to completion, no errors) and still produce bad data. For example, a pipeline that ingests data from an API where the API silently changed its schema will run successfully but load incorrect data. Data downtime captures all cases where data is unusable, regardless of whether the pipeline itself reported a failure.
What is the difference between data downtime and application downtime?
Application downtime means a service is unavailable (users see errors or pages don't load). Data downtime means data is present but wrong (dashboards render but show incorrect numbers). Application downtime is immediately visible. Data downtime is silent until someone checks. Application monitoring tools like Datadog do not detect data downtime because the infrastructure appears healthy even when the data is not.
What is a data downtime SLA?
A data downtime SLA is a formal commitment to maintain a target level of data uptime, measured as a percentage of total hours in a period. For example, a 99.5% monthly data uptime SLA allows roughly 3.6 hours of downtime per month. Teams define SLAs per pipeline tier: critical pipelines (revenue, compliance) get stricter targets than exploratory or internal-only pipelines.
How does data downtime relate to data quality dimensions?
Data downtime is the time-based consequence of failures across any of the six data quality dimensions: accuracy, completeness, consistency, timeliness, validity, and uniqueness. A completeness failure (missing rows) causes downtime from the moment rows stop arriving until backfill completes. A timeliness failure (stale data) causes downtime from the missed SLA until the refresh runs. Downtime is the unifying metric that converts dimension-level failures into business impact.
Should data downtime be tracked like application uptime?
Yes. Leading data teams apply the same SLA/SLO framework used for application reliability to data pipelines. Define a target (e.g., 99.5% data uptime per month, which allows roughly 3.6 hours of downtime), measure against it, and treat breaches with the same urgency as application outages. This approach, sometimes called "data SRE," is gaining adoption at companies that treat data as a production service rather than a back-office function.
Can you have zero data downtime?
In theory, yes. In practice, no. Data pipelines depend on external sources, third-party APIs, upstream teams, and infrastructure that will eventually fail. The goal is not zero downtime but rapid detection and resolution. A team with 15 incidents per month but a 5-minute TTD and 20-minute TTR will have less total downtime than a team with 2 incidents per month but an 8-hour TTD and 6-hour TTR.
How do you create a data incident response plan?
Start with six steps: assess blast radius, stop bad data from flowing, identify root cause, fix and validate, update the incident log, and prevent recurrence. Document common root causes (schema changes, freshness failures, volume drops) with specific runbooks for each. The goal is that any on-call engineer can resolve common incidents without escalation.
Data downtime shrinks when detection is automated. See how AnomalyArmor monitors freshness, schema changes, and anomalies across your data pipelines to cut TTD to minutes.