Data Pipeline Monitoring: How to Stop Silent Failures Before They Hit Production
Data pipeline monitoring catches silent failures that orchestration tools miss. Learn the 5 types of pipeline failures, why Airflow alerts aren't enough, and how to set up monitoring that actually prevents broken dashboards.

Your Airflow DAG shows all green. Every task completed. No errors in the logs.
But the revenue dashboard is showing yesterday's numbers. A downstream ML model is training on stale features. The finance team is about to close the quarter using incomplete data.
This is the most dangerous type of pipeline failure: the one that doesn't look like a failure at all. And it's far more common than the kind that throws an error.
Data pipeline monitoring exists to catch exactly this. Not job-level "did it run?" checks. Outcome-level "did the data actually arrive, and does it look right?" checks. The difference between those two questions is where most data incidents live.
What is data pipeline monitoring?
Data pipeline monitoring is continuous validation that data is flowing correctly through every stage of your pipeline, from ingestion to transformation to the tables your stakeholders query.
It covers five dimensions:
- Freshness: Is data arriving on schedule?
- Volume: Are the expected number of rows landing?
- Schema: Have columns been added, removed, or changed type?
- Distribution: Do the values look normal, or has something shifted?
- Lineage: When something breaks, which downstream tables and dashboards are affected?
Most teams start with the first two and add the rest as they scale. But even basic freshness and volume checks catch the majority of incidents that slip past orchestration tools.
The 5 types of pipeline failures (and which ones your tools miss)
1. The successful failure
A DAG runs to completion. Zero errors. But the source API returned an empty response, so the pipeline wrote zero rows. The orchestrator sees a successful run. The table is now empty or stale.
What catches it: Volume monitoring. If a table that normally receives 50,000 rows per load suddenly gets zero, that's an alert.
2. The schema surprise
Someone on the source team renames a column from user_id to userId. Your pipeline doesn't error, it just silently drops the column or fills it with nulls. Downstream joins break. Metrics go wrong. Nobody notices for three days.
What catches it: Schema change detection. Any added, removed, or type-changed column triggers an alert before downstream transformations run.
3. The slow drift
Data volumes gradually decrease by 5% per week. No single day looks alarming. But after a month, you're missing 20% of your records. A filter change upstream, a timezone bug, a partition misconfiguration.
What catches it: Distribution and volume trend monitoring. Anomaly detection that compares today's load against historical patterns, not just a static threshold.
4. The partial load
The pipeline runs, but only processes data from 3 of 5 source partitions. Row counts look lower than normal, but not dramatically. The missing data is from one region, so the aggregate metrics look "close enough" to pass a quick glance.
What catches it: Volume monitoring with granular baselines, comparing expected vs actual row counts at the partition or segment level.
5. The delayed cascade
A source table updates 4 hours late. Downstream transformations ran on schedule and processed stale input. The numbers are technically "fresh" (the downstream table updated on time) but wrong (it used yesterday's source data).
What catches it: Freshness monitoring on source tables, combined with lineage awareness that understands the dependency chain. The downstream table looks fresh, but tracing upstream reveals the root cause.
Why orchestration alerts aren't enough
Airflow, Dagster, Prefect, and similar tools monitor the process: did the job start, run, and finish? They answer "did my code execute?" not "did my data arrive correctly?"
Three specific gaps:
1. Successful jobs that produce wrong output. A job can complete with exit code 0 and write garbage. The orchestrator has no opinion about data content. It ran your code. That's its job.
2. No cross-system visibility. Your pipeline pulls from a Postgres source, transforms in dbt, and lands in Snowflake. The orchestrator sees the dbt run. It doesn't know the Postgres source stopped updating two hours before the dbt run kicked off.
3. No historical baselines. Orchestration tools tell you about this run. They don't tell you whether this run's output looks normal compared to the last 30 runs. A table loading 1,000 rows isn't alarming, unless it normally loads 100,000.
Data pipeline monitoring sits on top of orchestration. It checks what the orchestrator can't: the actual data that landed.
What good data pipeline monitoring looks like
Effective monitoring has four properties:
1. It monitors outcomes, not processes
Check the table, not the job. Did rows arrive? Are the columns intact? Do the values fall within expected ranges? This is the fundamental shift from orchestration monitoring.
2. It adapts to patterns
A static threshold of "alert if fewer than 10,000 rows" breaks when your table legitimately receives 2,000 rows on weekends. Good monitoring learns the pattern and alerts on deviations from it, not from a fixed number.
3. It maps dependencies
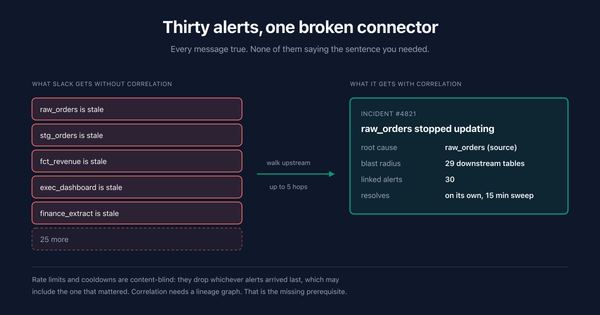
When a source table is late, you need to know which downstream tables, dashboards, and reports are affected. Without lineage, you're manually tracing dependencies across systems during an incident, which is the worst time to be doing it.
4. It routes alerts to the right people
A freshness alert on the marketing analytics table should go to the data engineering team that owns that pipeline, not to a shared #data-alerts channel that everyone has muted. Alert routing by ownership turns monitoring from noise into action.
How to set up data pipeline monitoring
Step 1: Identify your critical tables
You don't need to monitor everything on day one. Start with the 10-20 tables that power:
- Executive dashboards
- Customer-facing data products
- Financial reporting
- ML model features
These are the tables where a silent failure causes the most damage.
Step 2: Set freshness and volume baselines
For each critical table:
- Freshness: How often should this table update? Set the SLA slightly longer than the expected interval. A table that updates hourly gets a 2-hour SLA.
- Volume: How many rows does a typical load produce? Set a range based on the last 30 days, accounting for weekday/weekend variation.
Step 3: Enable schema change detection
Schema changes are the most common cause of silent pipeline failures. Any column added, removed, renamed, or type-changed should generate an alert. This catches problems at the source before they propagate downstream.
Step 4: Connect your alert channels
Route alerts to Slack, PagerDuty, or email based on table ownership. The person who gets the alert should be the person who can fix it.
Step 5: Expand gradually
Once your critical tables are monitored, expand to the next tier. Most teams reach full coverage within a few weeks, not months.
The build vs buy decision
You can build basic monitoring with SQL queries and a scheduler. Check INFORMATION_SCHEMA for freshness, run COUNT(*) for volume, compare schemas against a stored baseline.
This works for 5-10 tables. At 50+ tables across multiple databases, you're maintaining:
- A custom scheduler running checks every 15-60 minutes
- Per-table configurations for thresholds and SLAs
- Historical storage for baselines and trend comparison
- Alert routing logic by table ownership
- A UI for your team to see monitoring status
At that point, the monitoring system is its own engineering project. The question is whether your team's time is better spent maintaining monitoring infrastructure or building data products.
Purpose-built tools like AnomalyArmor handle this out of the box. Connect your warehouse, and freshness, volume, and schema monitoring start automatically. AI-powered analysis explains what changed and why, so you spend less time investigating and more time fixing. Setup takes minutes, not weeks.
Common mistakes to avoid
Setting thresholds too tight. A freshness SLA of 61 minutes on a table that updates hourly will fire every time there's a minor delay. Start generous and tighten over time.
Monitoring everything equally. Not every table is critical. A staging table that only you use doesn't need PagerDuty integration. Prioritize by downstream impact.
Ignoring weekends and holidays. Many pipelines have legitimately different patterns on weekends. Your monitoring needs to account for this or you'll get false alerts every Saturday.
Alert channel sprawl. Sending every alert to a shared Slack channel guarantees they'll be ignored. Route alerts to the specific team that owns the pipeline.
Treating monitoring as a one-time setup. Your pipelines change. New tables get added, old ones get deprecated, schedules shift. Monitoring configuration needs to evolve with your data stack.
FAQ
What's the difference between data pipeline monitoring and data observability?
Data pipeline monitoring focuses on whether data is flowing correctly through your pipelines: freshness, volume, schema. Data observability is the broader discipline that includes monitoring plus lineage, root cause analysis, and historical context. Monitoring is the foundation. Observability is the full picture.
Do I need monitoring if I already use dbt tests?
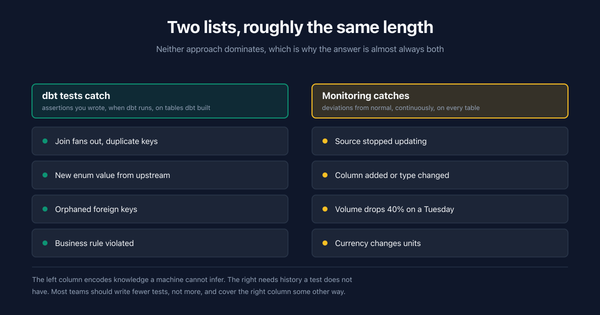
Yes. dbt tests validate data at transformation time. They check "is this data correct right now?" Monitoring checks "is this data arriving on schedule, in the expected volume, with the expected schema?" They answer different questions. dbt tests catch logic bugs. Monitoring catches infrastructure and upstream failures.
How many tables should I monitor?
Start with your 10-20 most critical tables. Expand from there. Most teams reach full coverage (all production tables) within a few weeks. The goal is 100% coverage of anything that powers a decision, dashboard, or downstream system.
What's the right alert threshold for freshness?
Set it at 1.5-2x your expected update interval. A table that updates every hour should alert at 2 hours. A daily table should alert at 25-26 hours. This avoids false alarms from minor delays while catching real failures.
Can I build my own pipeline monitoring?
You can, and many teams start there. SQL queries checking freshness and row counts are straightforward for a handful of tables. The maintenance burden grows quickly at scale. Most teams that start DIY either invest significant engineering time maintaining it or switch to a purpose-built tool within 6-12 months.
Data Pipeline Monitoring FAQ
What is data pipeline monitoring?
Data pipeline monitoring is the practice of tracking data pipelines end-to-end to catch failures, delays, and anomalies before they affect downstream consumers. It covers both the jobs themselves (did they run, did they succeed?) and the data they produce (is it fresh, complete, correct?). Monitoring catches silent failures that orchestration alerts miss.
What's the difference between pipeline monitoring and pipeline orchestration?
Orchestration tools (Airflow, Dagster, Prefect) schedule and run jobs. Monitoring tools observe whether the data produced by those jobs is correct. A pipeline can succeed at the orchestration layer while producing broken data: a query returns zero rows, a schema change breaks transformations silently, or an upstream source sends stale data. Orchestration alerts don't catch any of these.
Why do silent data pipeline failures happen?
Silent failures happen because most monitoring focuses on job success, not data correctness. Common causes: upstream schema changes that cause silent NULL returns, filter changes that return empty result sets, timezone bugs, cached queries returning stale data, partial loads marked as successful, and permission changes that read only a subset of data. Each of these can pass orchestration checks while producing wrong downstream data.
What should I monitor in a data pipeline?
At minimum, monitor five things: job status (did it run?), freshness (is the data current?), volume (is the row count within expected range?), schema (did the structure change?), and values (are columns within expected distributions?). Advanced monitoring adds lineage tracking and cross-pipeline correlation.
How do I detect silent data failures?
Look at the data, not just the job. Run statistical checks on each pipeline output: row count z-scores, null rate changes, distinct value counts, and freshness deltas. Compare against historical baselines. When a pipeline succeeds but the data deviates from expectations, that's a silent failure worth alerting on.
Are Airflow alerts enough for data pipeline monitoring?
No. Airflow alerts tell you whether tasks succeeded or failed. They don't tell you whether the data is correct. A Python task can succeed by returning an empty DataFrame. A SQL task can succeed by selecting from a stale source. Airflow has no way to know this. You need a separate layer that checks the data itself.
What is data lineage and why does it matter for pipeline monitoring?
Data lineage is the map of how data flows from sources through transformations to outputs. When a pipeline fails, lineage tells you which downstream consumers are affected. This turns a single alert into actionable impact analysis: "the orders table is stale, which breaks the revenue dashboard, the CAC report, and the retention model." Without lineage, you have to investigate manually.
How do I monitor data pipeline latency?
Track the time between when raw data arrives and when it's available in the final table. Store timestamps at each pipeline stage and compute end-to-end latency. Alert when latency exceeds an SLA. Most orchestration tools expose task duration metrics, but stitching them into end-to-end latency requires custom tracking.
What are the most common data pipeline failure modes?
In order of frequency: (1) upstream source outages, (2) schema drift breaking transformations, (3) stale source data causing incorrect joins, (4) resource exhaustion (out of memory, timeouts), (5) permission changes blocking reads, (6) API rate limits, (7) data type mismatches, (8) duplicate ingestion, (9) timezone bugs, (10) configuration errors.
How do I set up data pipeline monitoring without a dedicated tool?
Write freshness checks in dbt tests or custom SQL scheduled in Airflow. Use Airflow SLAs for latency. Add row count assertions after each transform. This works for 5-20 critical tables. Past that, you need a dedicated tool because maintaining alert routing, incident history, and cross-pipeline analysis becomes its own full-time job.
AnomalyArmor monitors data pipelines end-to-end without touching your pipeline code. [See how the AI agent sets up monitoring in seconds.](https://blog.anomalyarmor.ai/using-ai-to-set-up-schema-drift-detection/)